

This technical indicator for trading and investment compares the momentum between two instruments. This means it compares the impulse and strength of these instruments. And what’s most notable about SPEARHEAD: one of these instruments is a synthetic index created by the user, or in other words, created by SPEARHEAD according to your needs. This comparison also includes the direction of the momentum for each instrument: the direction of your index's momentum (whether bullish or bearish) and the direction of the reference instrument’s momentum that you have chosen. All of this is displayed below the price chart.
The synthetic instrument that SPEARHEAD creates for you can include up to seven different assets. These assets can be stocks, commodities, indices, ETFs, bonds, currencies... as long as they share the same trading calendar. Your index is configured to measure the combined momentum of the included assets, either equally or weighted.

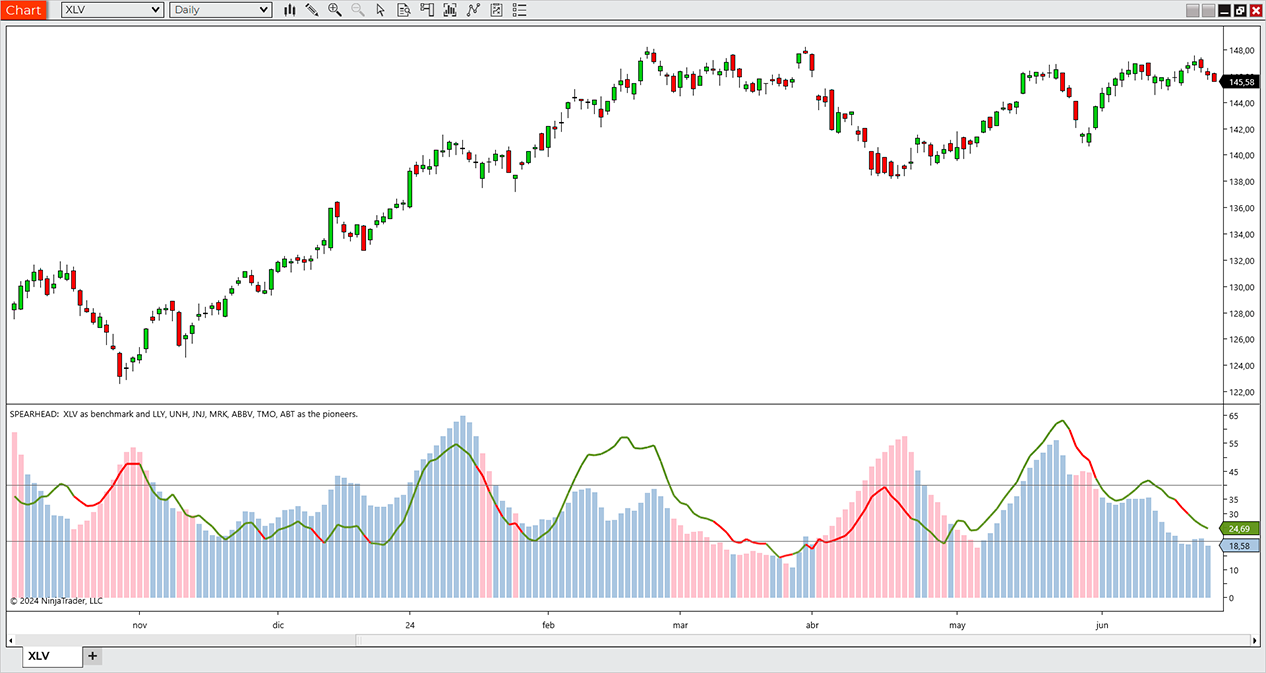
When applied to your chart, SPEARHEAD appears in a separate panel from the price data, as you can see in the images. The background bars correspond to the momentum of the reference instrument, while the overlaying line represents the momentum of the synthetic instrument created by you. Both the bars and the line are color-coded to indicate the direction of the momentum. We will cover this in more detail below.
Additionally, the colors automatically adapt to the chart's skin. The following image shows how it looks when the theme set is NinjaTrader Dark.

We will also cover the meaning, use, and configuration of the two horizontal lines later. You will get everything you need to make the most of SPEARHEAD.

SPEARHEAD measures the momentum of both your custom instrument and the reference instrument based on the calculations of the Average Directional Index (ADX) created by John Welles Wilder in 1978. This proven method provides a reliable foundation for SPEARHEAD’s momentum analysis, ensuring consistent and accurate comparisons between the two instruments.
SPEARHEAD is compatible with NinjaTrader's backtesting capabilities. You can test your strategies using historical data to evaluate the effectiveness of your synthetic instruments and comparison settings over time. This allows you to refine your trading strategies and optimize your use of SPEARHEAD to improve decision-making and maximize returns.
The name SPEARHEAD derives from its primary use case: focusing on key components within a group of financial assets. For example, you can track the “seven magnificent” companies with the largest market capitalization in the U.S., including their stocks in your custom index. Together, they represent more than 50% of the Nasdaq-100 index. By monitoring these key stocks, which act as the spearhead of the index, you can gain insights into the overall behavior of the index more effectively than by analyzing the other 93 companies.
Another significant application of SPEARHEAD is tracking the momentum and direction of your investment portfolio. Imagine the advantage of comparing your portfolio with a benchmark of your choice, such as a government bond or another preferred asset, based on your risk exposure and expectations. This enables personalized insights and better-informed investment decisions.
In addition to offering multiple use scenarios, it gives you freedom within each one. Adding a momentum reading instead of just guiding yourself by prices complements and strengthens your market vision. But more importantly, your specific market. Your needs will lead you to configure it in a way that will be different from how another investor or trader configures it. What else is this but flexibility? The possibilities are vast and depend on your specific trading or investment style. You could even discover configurations that no one has explored before, with the advantages that this implies. Whether you are looking to uncover hidden opportunities or track general trends, SPEARHEAD is a solid support for your strategy.
You might wonder if configuring SPEARHEAD is complicated. Absolutely not! Let’s see how easy it is to set it up.
Click Buy Now and get lifetime access to SPEARHEAD 💪
Or consider our Subscribe option
and enjoy all the benefits of SPEARHEAD for a monthly fee.
Let’s explore the configuration possibilities. Despite the power and adaptability of SPEARHEAD, setting it up doesn’t take much time.

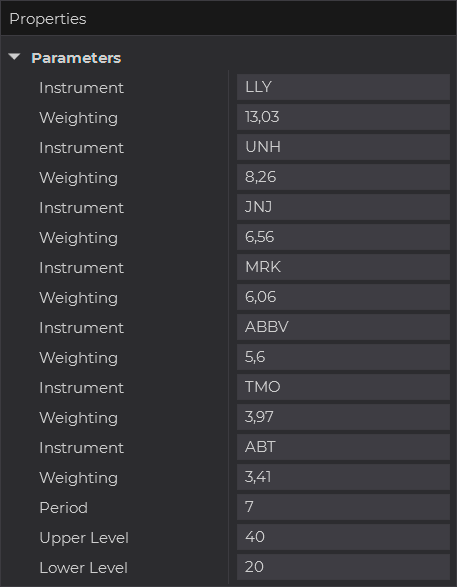
You can include up to seven instruments in your custom index. The image shows the seven most weighted stocks in the Health Care Select Sector SPDR Fund (XLV) ETF, along with their respective weightings. For example, Eli Lilly (LLY) has a weighting of 13%, and UnitedHealth Group (UNH) has 8%. By entering the weightings of the reference instrument, SPEARHEAD will calculate the proportions of your custom index.
If you want to give the same weight to all the components of your index, you don’t need to do any special calculations. Just fill in the Weighting fields with the same number, for example, 1.
You can also directly enter the exact proportions you want. Assuming a portfolio of five assets, you could use 14%, 21%, 20%, 19%, and 26%. All combined values must not exceed 100%.
The instruments do not need to be entered in a specific order; just make sure the percentage is placed below each symbol.
It’s also not necessary to use all seven symbols. To use fewer, simply enter the number 0 in the Weighting fields of the positions you don’t want to include, and SPEARHEAD will understand.
Using the save function in a NinjaTrader template is very useful for maintaining different configurations.

The Period setting is crucial for SPEARHEAD's calculations based on the ADX. The integer you enter in Period will influence the sensitivity and responsiveness in your momentum analysis.
In contrast, the Upper Level and Lower Level fields do not affect these calculations. They simply draw lines on the chart according to your strategy. If you prefer not to use these levels, you can set them to 0. If you want to master these levels, start by interpreting them as ADX-based strategies do.

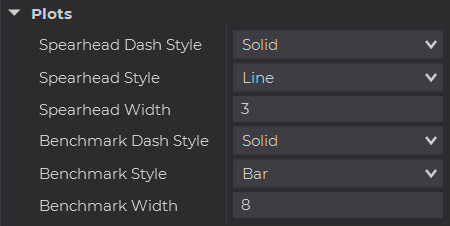
Although it’s not necessary, you can adjust the Dash Style, Style, and Width settings for both the SPEARHEAD line (your index) and the reference instrument. For example, in the image below, you can see how the reference instrument bars have been changed to a dashed line.
The colors are not configurable because they depend on the calculations. The reference instrument is colored in some shade of blue when the DM Directional Movement is positive and red when it is negative. The SPEARHEAD line graph follows the same criteria, with the difference that green is used instead of blue.

Remember that the exact shades are automatically defined according to the panel background color, so you can keep your favorite color settings, and the indicator will adapt its colors for easy visualization.

SPEARHEAD provides a market viewpoint from your position, wherever you decide to position yourself. This is not comparable to other indicators. Consider tracking key assets in instruments with many underlyings or monitoring your investment portfolio as examples. You can explore new utilities. Maybe create an index of a country’s commodities to compare its momentum with that of the country's currency—provided both instruments share the same trading calendar. Within this condition, SPEARHEAD adapts and can make sense of your ideas.